Drought
-
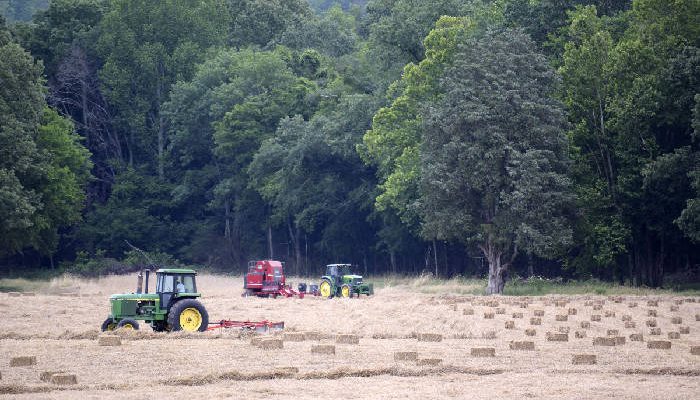
In the past few weeks I’ve been getting phone calls from cattle producers in NW Georgia and NE Alabama to complain about the Drought Monitor depiction in their area. Many of these counties have not seen much if any rain in weeks, and with the higher than normal temperatures we are experiencing, their soils are…
-
The latest Drought Monitor shows significant increases in drought in Virginia and North Carolina with slightly smaller increases in Alabama, Georgia, South Carolina and Florida this week. Almost no rain fell in the region in the past week, contributing to the expansion of drought. The completely dry conditions are expected to last for another week…
Posted in: Drought -

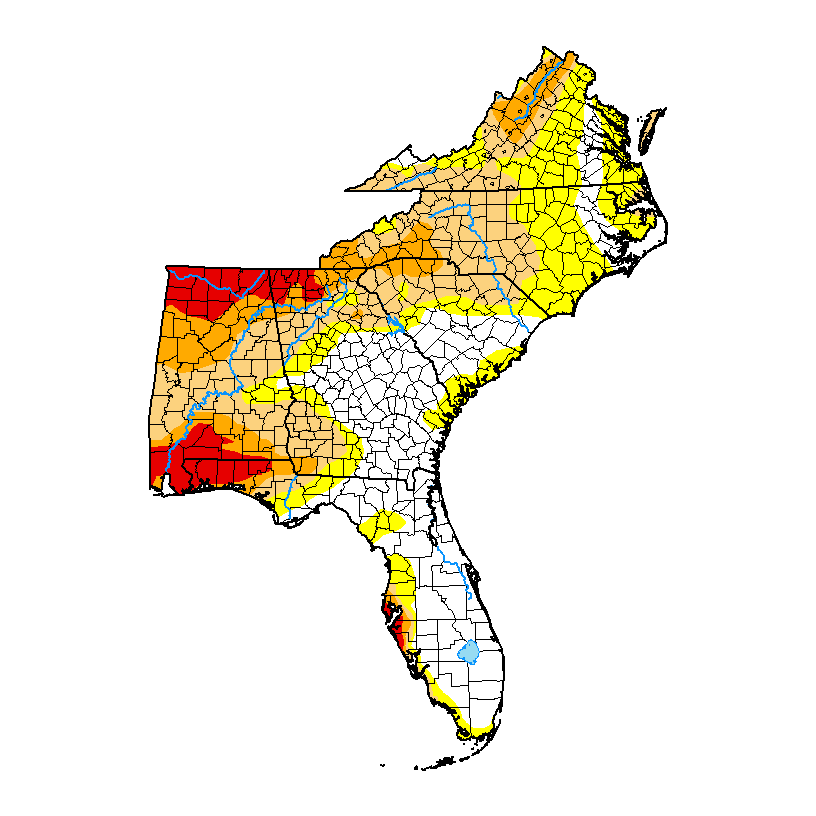
The latest Drought Monitor, released today, shows an expansion of extreme (D3) drought in Alabama as well as its introduction into far NW Georgia this week due to an almost complete absence of rain. Drought also expanded slightly in North Carolina, South Carolina, and Florida and remained the same in Virginia. In Puerto Rico, the…
Posted in: Drought -
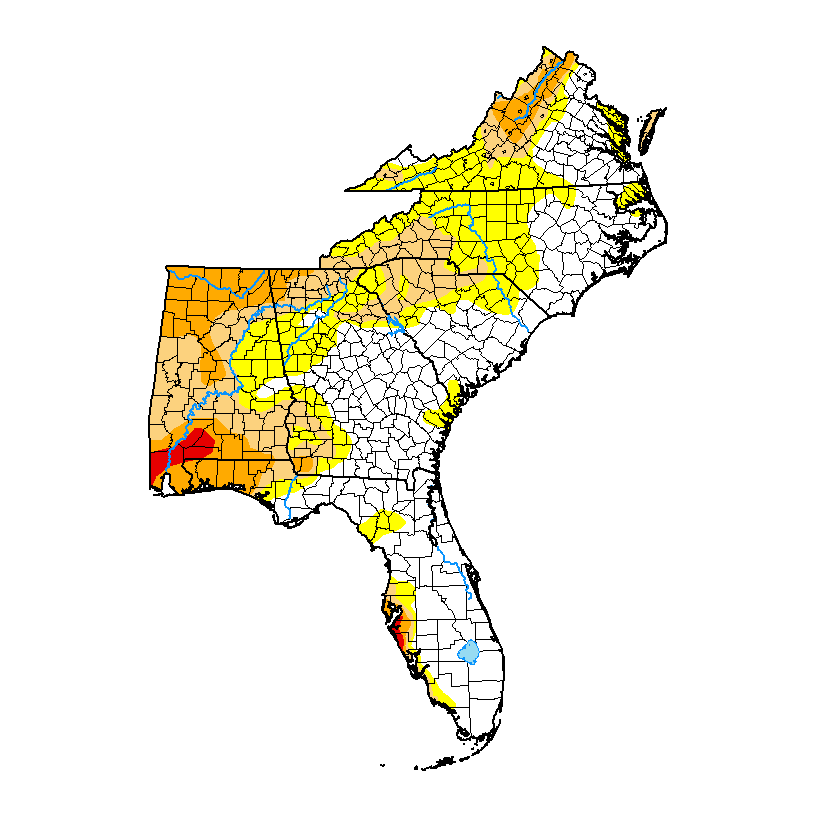
The latest Drought Monitor, released today, shows the expansion of drought across most of the region, especially in northern and western parts of the states. Florida was the only state that saw an improvement in dry conditions, and Puerto Rico showed no change from last week. With relatively light rainfall amounts expected this week, it…
Posted in: Drought -
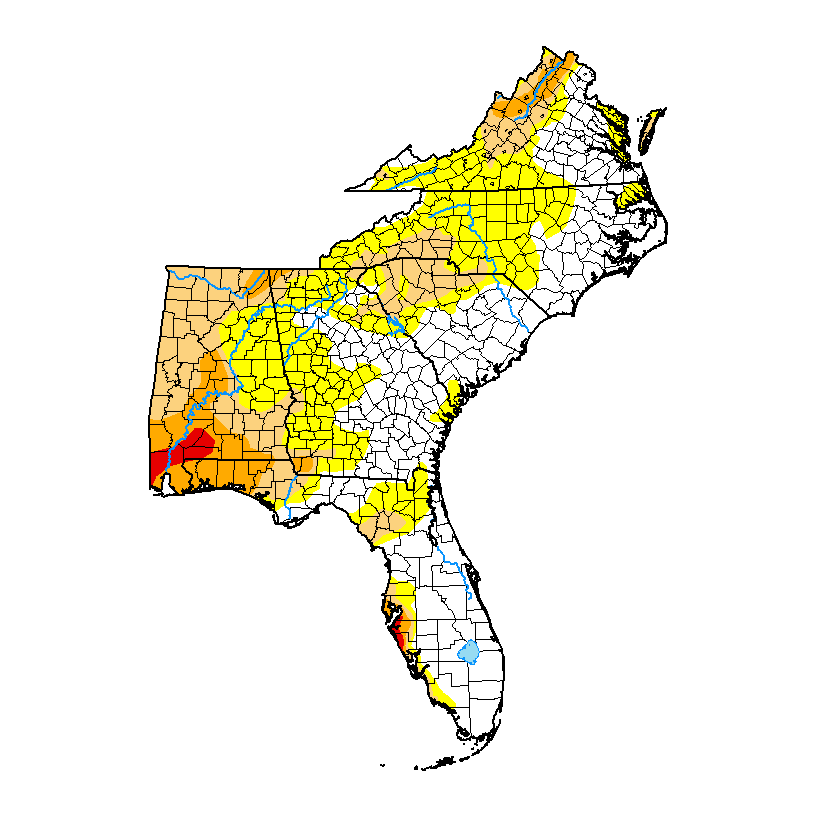
The latest Drought Monitor, released this morning, shows that drought expanded in every state in the region but decreased slightly in Puerto Rico. Note that Alabama is completely covered by dry conditions, although it is not all officially classified as drought at this point. The cutoff for this map was before the rain that hit…
Posted in: Drought -

A mostly dry week coupled with above-normal temperatures has led to the expansion of drought in many parts of the region, according to the latest Drought Monitor that was released today. The largest increase was in Alabama, where most of the state is now covered by some level of drought, but most other stations also…
Posted in: Drought -

If you like to look at interesting visualizations of data, you may be interested in this new visualization of streamflow drought across the United States from USGS streamflow data. It uses bar graphs to show how long and how severe a drought got at particular streamflow gauges and how many gauges were affected by the…