One of the amazing things about this summer (to me) has been the unrelenting nature of the heat this year. We’ve had very few days over 100 F and most days were nowhere near a record temperature for the date, but the number of runs of days above thresholds like 90 F for max temperatures and 70 F for min temperatures has been impressive. Many stations have set new all-time records for number of days in a row above one of these thresholds, and others have set records for total number of days (not necessarily in a row) above these thresholds. As I write this, Atlanta for one is still going strong with 71 days in a row with minimum temperatures at or above 70 F, although I expect that to end in the next few days when a cold front finally comes through. You can see on the Atlanta thermograph that every day has max temperatures and min temperatures above the averages (in green). Happily, the lack of record-setting high temperatures has made this summer not feel too bad by comparison to some years when we have had many days in the upper 90s or even 100s.
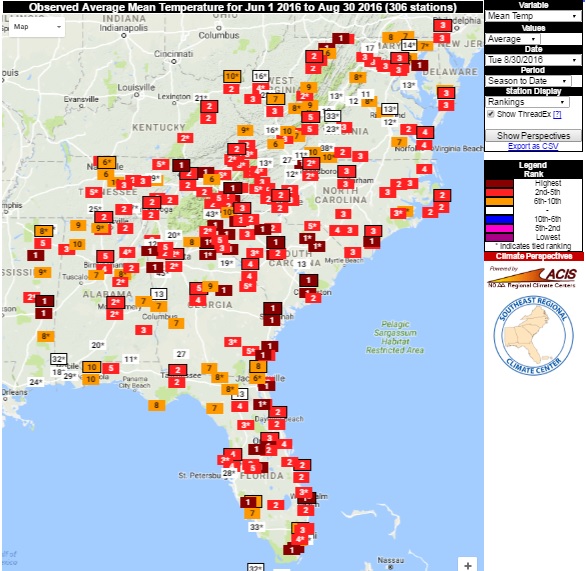
The result of all this heat–many stations will be at or near their highest average temperatures for the summer season. The ranking map below is from the Southeast Regional Climate Center’s Perspectives tool and the thermograph is from the Midwestern Regional Climate Center’s cli-MATE dataset.
If you’re interested in hearing more about it, I did an interview with Georgia Public Broadcasting this morning on the topic. You can listen to the interview at https://gpbnews.org/post/could-2016-be-georgia-s-hottest-ever.