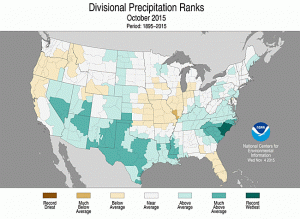
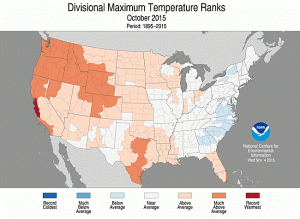
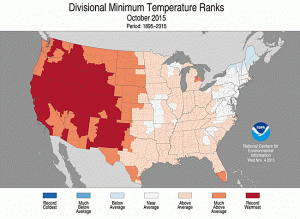
NOAA’s latest set of maps summarizing the climate of the US shows that for October, the contiguous 48 states were the fourth warmest since records began in 1895. For the January through October period, the nation was the 6th warmest on record. You can see the breakdown by climate division in the maps below.
I’ve also included the maps for maximum and minimum temperature separately. You can see that a lot of the warming is in minimum (usually nighttime) temperatures, with cooler rankings for most of the Southeast in maximum (daytime) temperatures.
You can get the full report when it is available at https://www.ncdc.noaa.gov/sotc/national/201510.


