How much did it rain last week? This is a question I get asked frequently by a variety of people, including Extension agents and producers. There are many sources of weather and climate data, but two I find particularly useful because of their map formats are listed below.
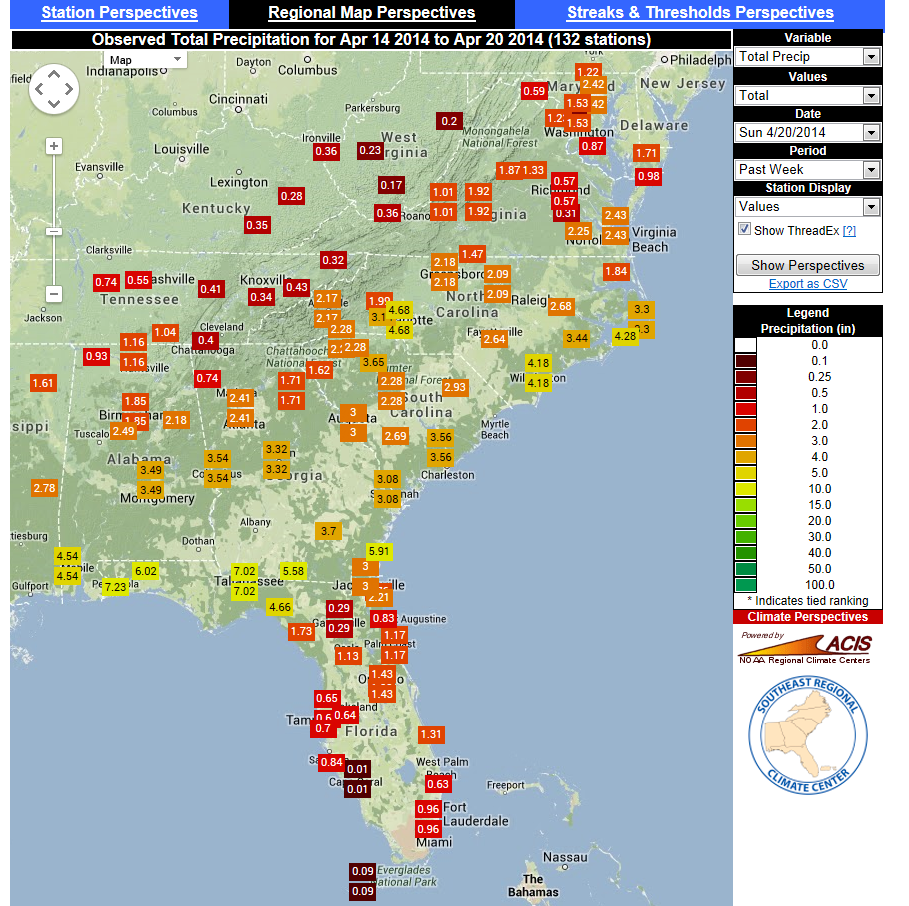
The first is the precipitation map tool from the Southeast Regional Climate Center. It can be found at https://www.sercc.com/perspectivesmap. It is based on midnight to midnight precipitation measurements. Here is this morning’s 7-day rainfall map.
If you live in an area far from one of the official weather stations, you might be interested in a second source of rainfall data from the NWS. Their radar-estimated rainfall maps show the gradation of precipitation across the area and can identify differences in rainfall amount across relatively short distances. You can find this mapping tool at https://water.weather.gov/precip/. It allows you to pick daily rainfall as of 7 AM each day or look at accumulations over a set of different time periods and regions. It is based on 7 AM to 7 AM measurements. Here is this morning’s 7-day accumulation.
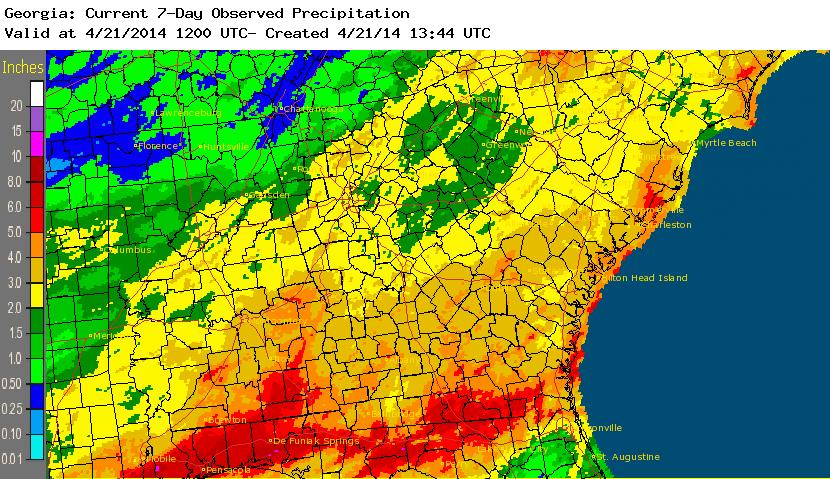
If you look carefully, there are some differences between the two maps. These are due to the different technologies used to create each map. The SERCC maps are based on ground stations with carefully sited rain gauges. The radar map is based on estimated rainfall using computer algorithms which track rainfall intensity and sum it up over time. The radar map is calibrated using the rain gauge data from the stations in the top map, but over time the differences can accumulate, leading to differences between the two maps, although generally they are very close when looking at the same time period.
There are many other sources of climate data on the web. In future posts I will be showing you some more of these resources.